
The Raw Trade Log
No simulated results. No hidden drawdowns. Every single execution logged with precise entry, exit, and risk-to-reward metrics across all market conditions.
The Performance Metrics
Our statistical edge is defined by mathematical expectancy, not luck. We track every metric to refine our playbook templates and maintain institutional risk standards.
58.4%
2.41
-6.2%
Strict position sizing and stop-loss discipline keep capital preservation as our absolute priority.
Average win rate calculated across twelve consecutive months of systematic options execution.
Gross profits divided by gross losses, demonstrating a highly sustainable risk-to-reward ratio.
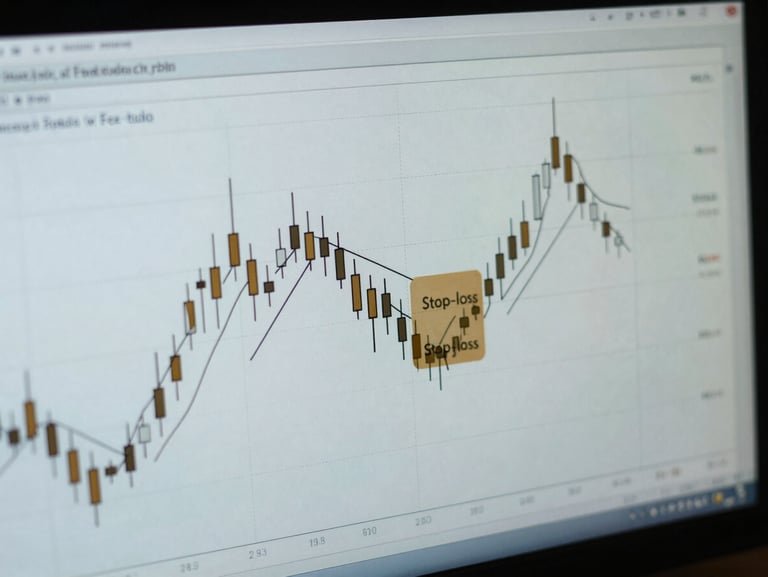
Anatomy of a Loss
Losing trades are inevitable. The difference lies in execution. We analyze our failures openly to demonstrate how strict stop-loss parameters protect our entire portfolio.
Strict Capital Preservation
When a setup invalidates, we exit immediately. By mapping risk before entry, we ensure no single loss impacts our long-term statistical edge. Yesterday's trade log shows exactly where our execution saved capital.
Observe the Tape
Join our daily pre-market preparation webinars and watch live execution in real time. See how we apply these exact risk metrics under live market pressure.